Read the article
here.The Blizzard of 2026 put more than 40 million people across eight states under blizzard warnings, one of the largest snowstorms to hit the region in a decade1. Knocking out power to more than 650,000 customers at its peak, much of the Northeast, from Maryland to Maine, was subject to whiteout condition.
What made this storm a genuine forecast challenge was its track: A low pressure system had spun up off that had formed off the North Carolina coast on February 22 and deepened explosively as it climbed the Eastern Seaboard2. In the days leading up to the landfall, most major models predicted the heaviest snow would be offshore. For context, a shift of 50 to 100 miles in the storm track was the difference between two feet of snow vs flurries in the in the heavily populated I-95 corridor from Philadelphia to Boston.
In this report, we demonstrate the capabilities of WeatherMesh-6 at a lead time of six days. This success can bring forecast confidence to meteorologists, energy grid operators, public works departments, and others during the preparation phase leading up to a major snow event.
Setup

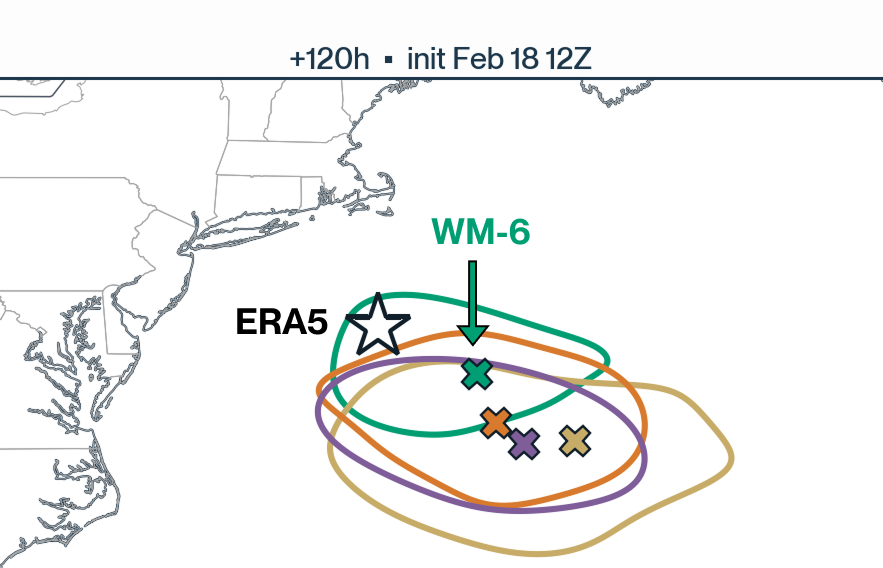
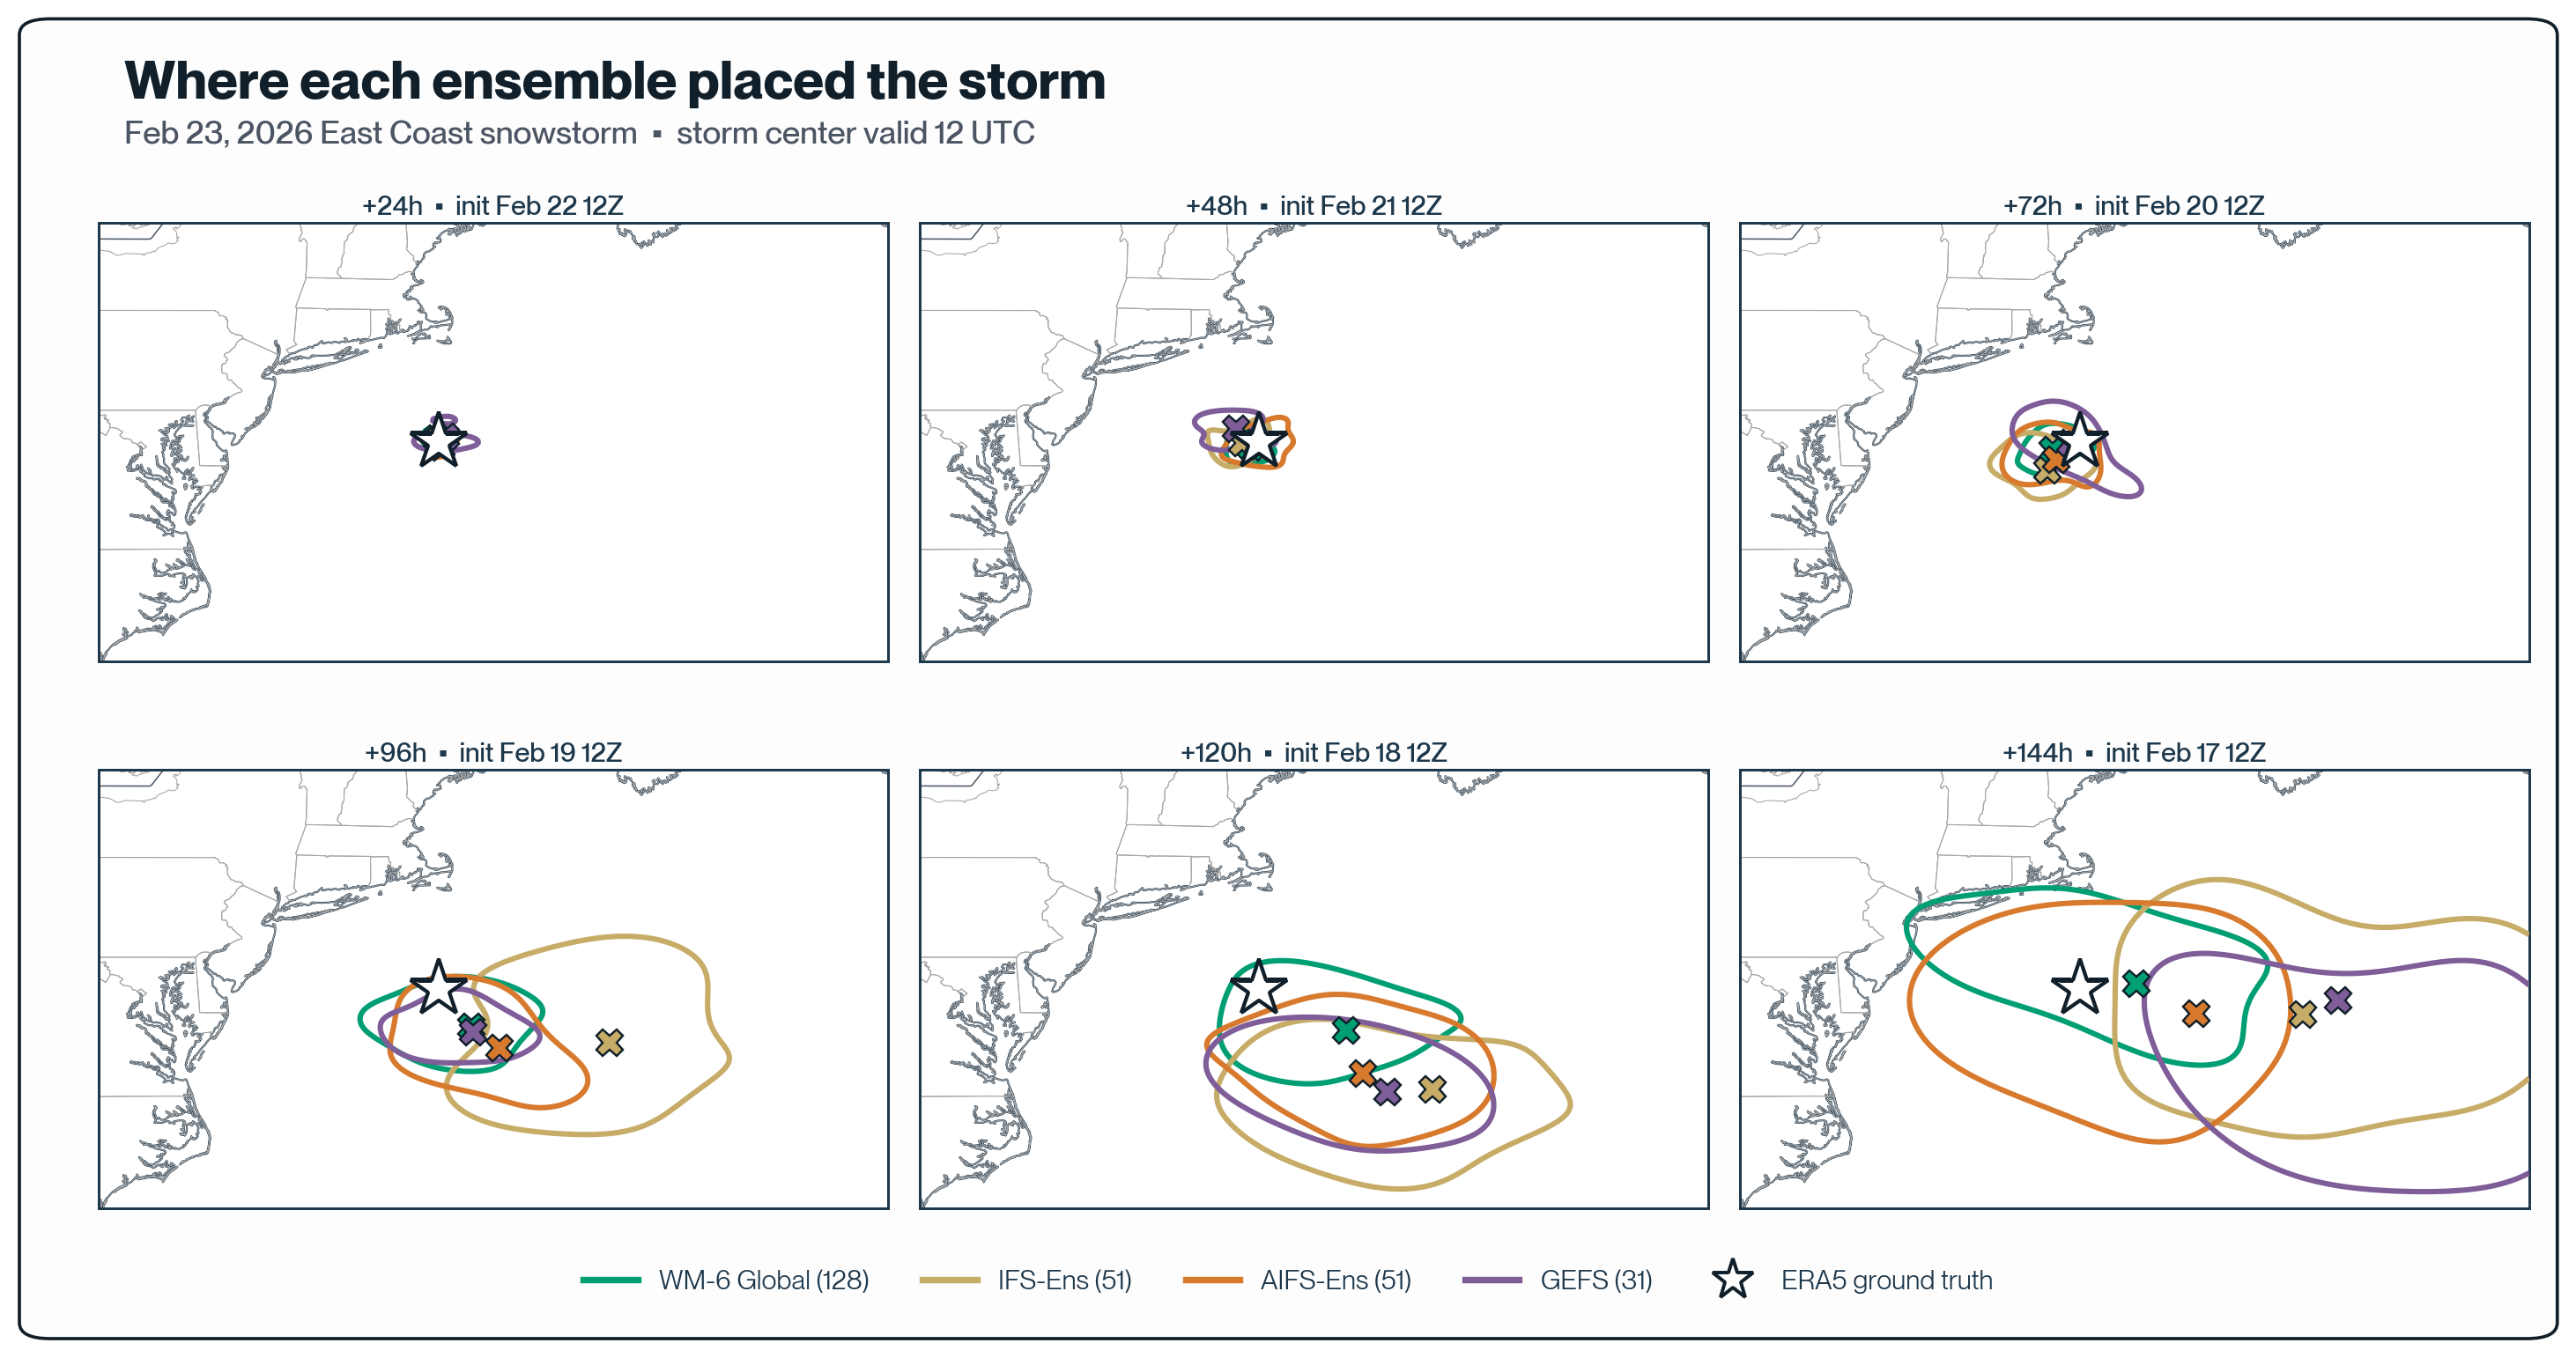
Six days before the storm landed, on February 17, the WeatherMesh-6 ensemble had the strongest signal of a major snowstorm out of all major model suites: a deeper cyclone, closer to the coast, with heavier precipitation inland. The other major ensemble forecasts were scattered on both the location and intensity of the system.
Six days ahead, only WeatherMesh had a storm worth the name.

Two days later, by February 19, the models converged. GEFS deepened its low, AIFS pulled its center back toward the coast, and the precipitation bands sharpened. WeatherMesh remained the closest match on all three fields, though the gap had narrowed.
The other models didn't lock onto the storm until roughly four days out. WeatherMesh had it at six. That ~48 hour gap is a critical window that matters downstream of a forecast: time for a grid operator to secure reserves, for airlines to notify passengers, and for a trader to move before the rest of the market does.
Why did WeatherMesh recognize the storm 2 days before other models? Below, we examine several patterns that explain this edge.
Results
1. WeatherMesh committed to the extreme instead of hedging toward the average.
Ensemble means tend to underplay extremes and this is especially true of AI ensembles. Averaging many member forecasts smooths the forecasts, and at long range, where members scatter, the average pulls toward a milder, more ordinary outcome3. Six days from a historic blizzard IFS, AIFS, and GEFS spread their members across the Atlantic, and their means settled on a soft, shallow low.
WeatherMesh's members had already converged on the deep storm; as seen above, its mean stayed sharp and placed the low closest to where it actually formed. It committed to the extreme instead of hedging toward the average.
WeatherMesh-6 models a full ensemble in latent space, architecture that produces members that are individually realistic. This ensemble clustering adds confidence to the impacts that would be observed on the ground in major metropolitan areas like Washington, D.C., New York City, and Boston. This confidence brings significant social and financial value to meteorologists, energy grid operators, public works departments, and others as they can prepare for this storm with confidence days ahead of when they would be able to when only utilizing other model outputs.
2. WeatherMesh's hourly reruns sharpened the forecast continuously.
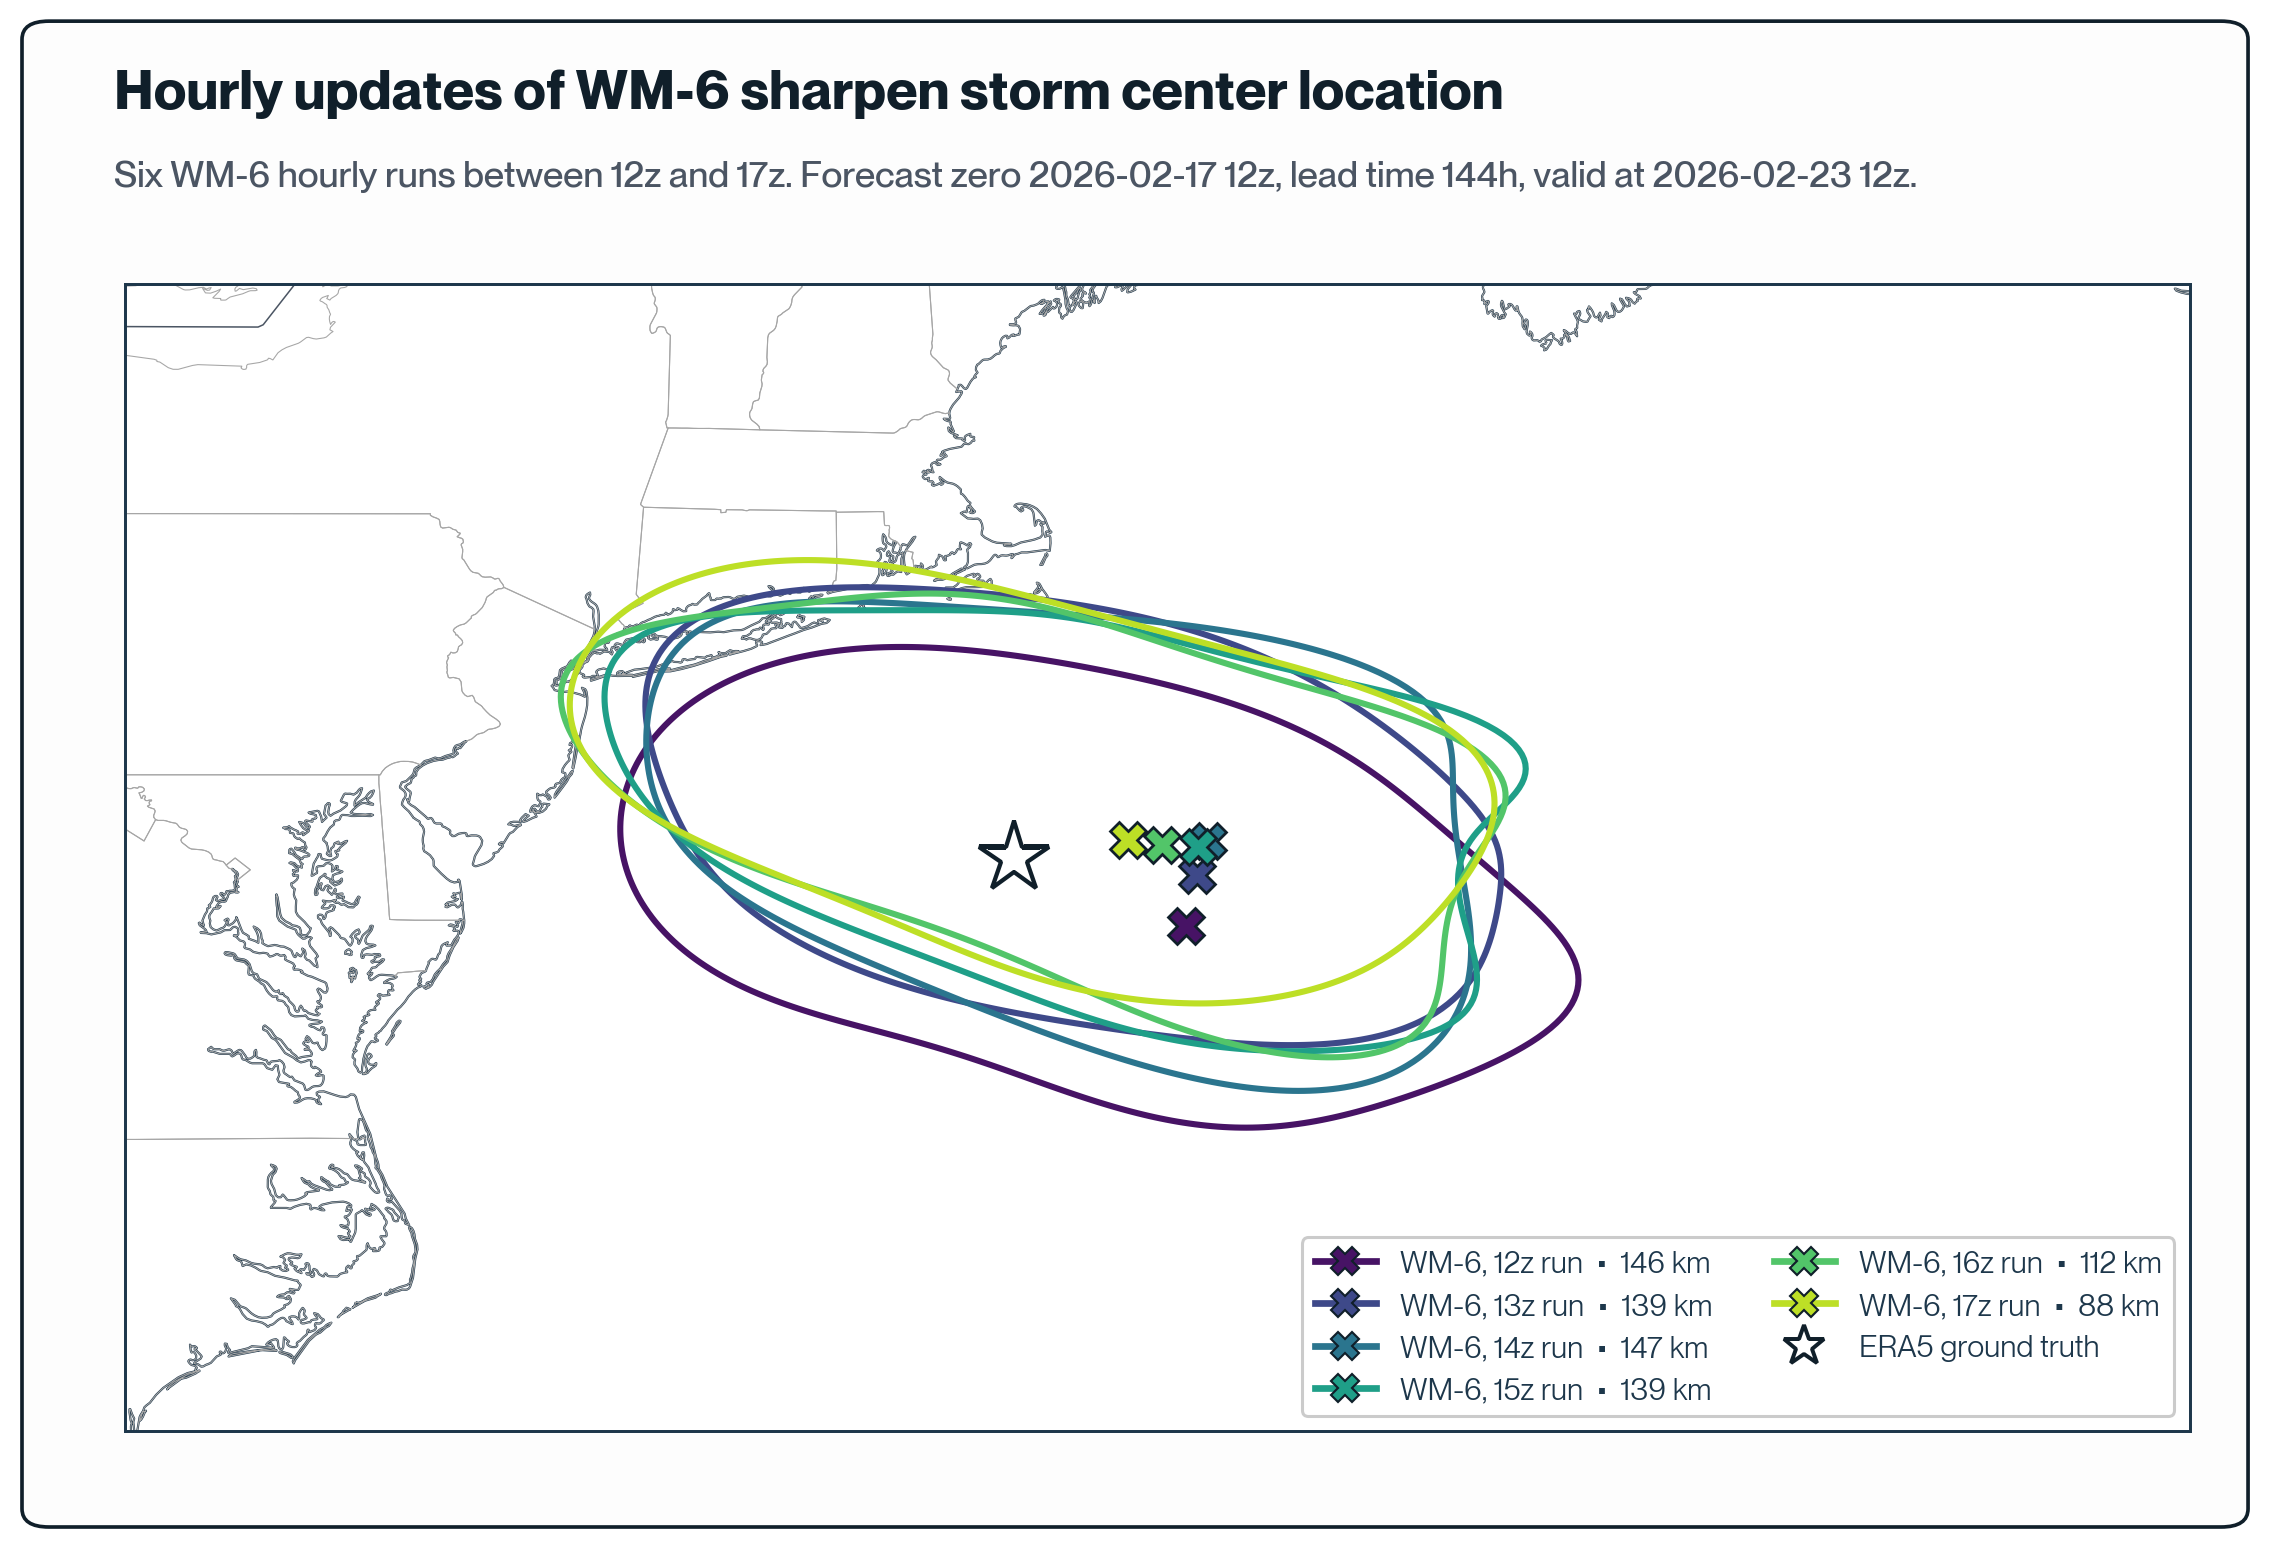
Across the morning of the 17th, as new observations arrived, WeatherMesh's forecast for that same six-day-out storm center tightened from 146 km to 88 km over five hours. Most ensembles update every 6 or 12 hours. WeatherMesh reruns hourly, so its picture of the storm sharpens continuously through the day. By the time the next conventional cycle would land, WeatherMesh had already refined its forecast several times.
On top of the standard observation suite used by other models, WeatherMesh-6 is uniquely able to assimilate observations from WindBorne’s network of Global Sounding Balloons. This fleet allows WindBorne to collect atmospheric data from locations that weren’t able to be reached before; a top-down approach that leads to material improvements in forecast quality.
3. WeatherMesh read the rain-snow line others missed.
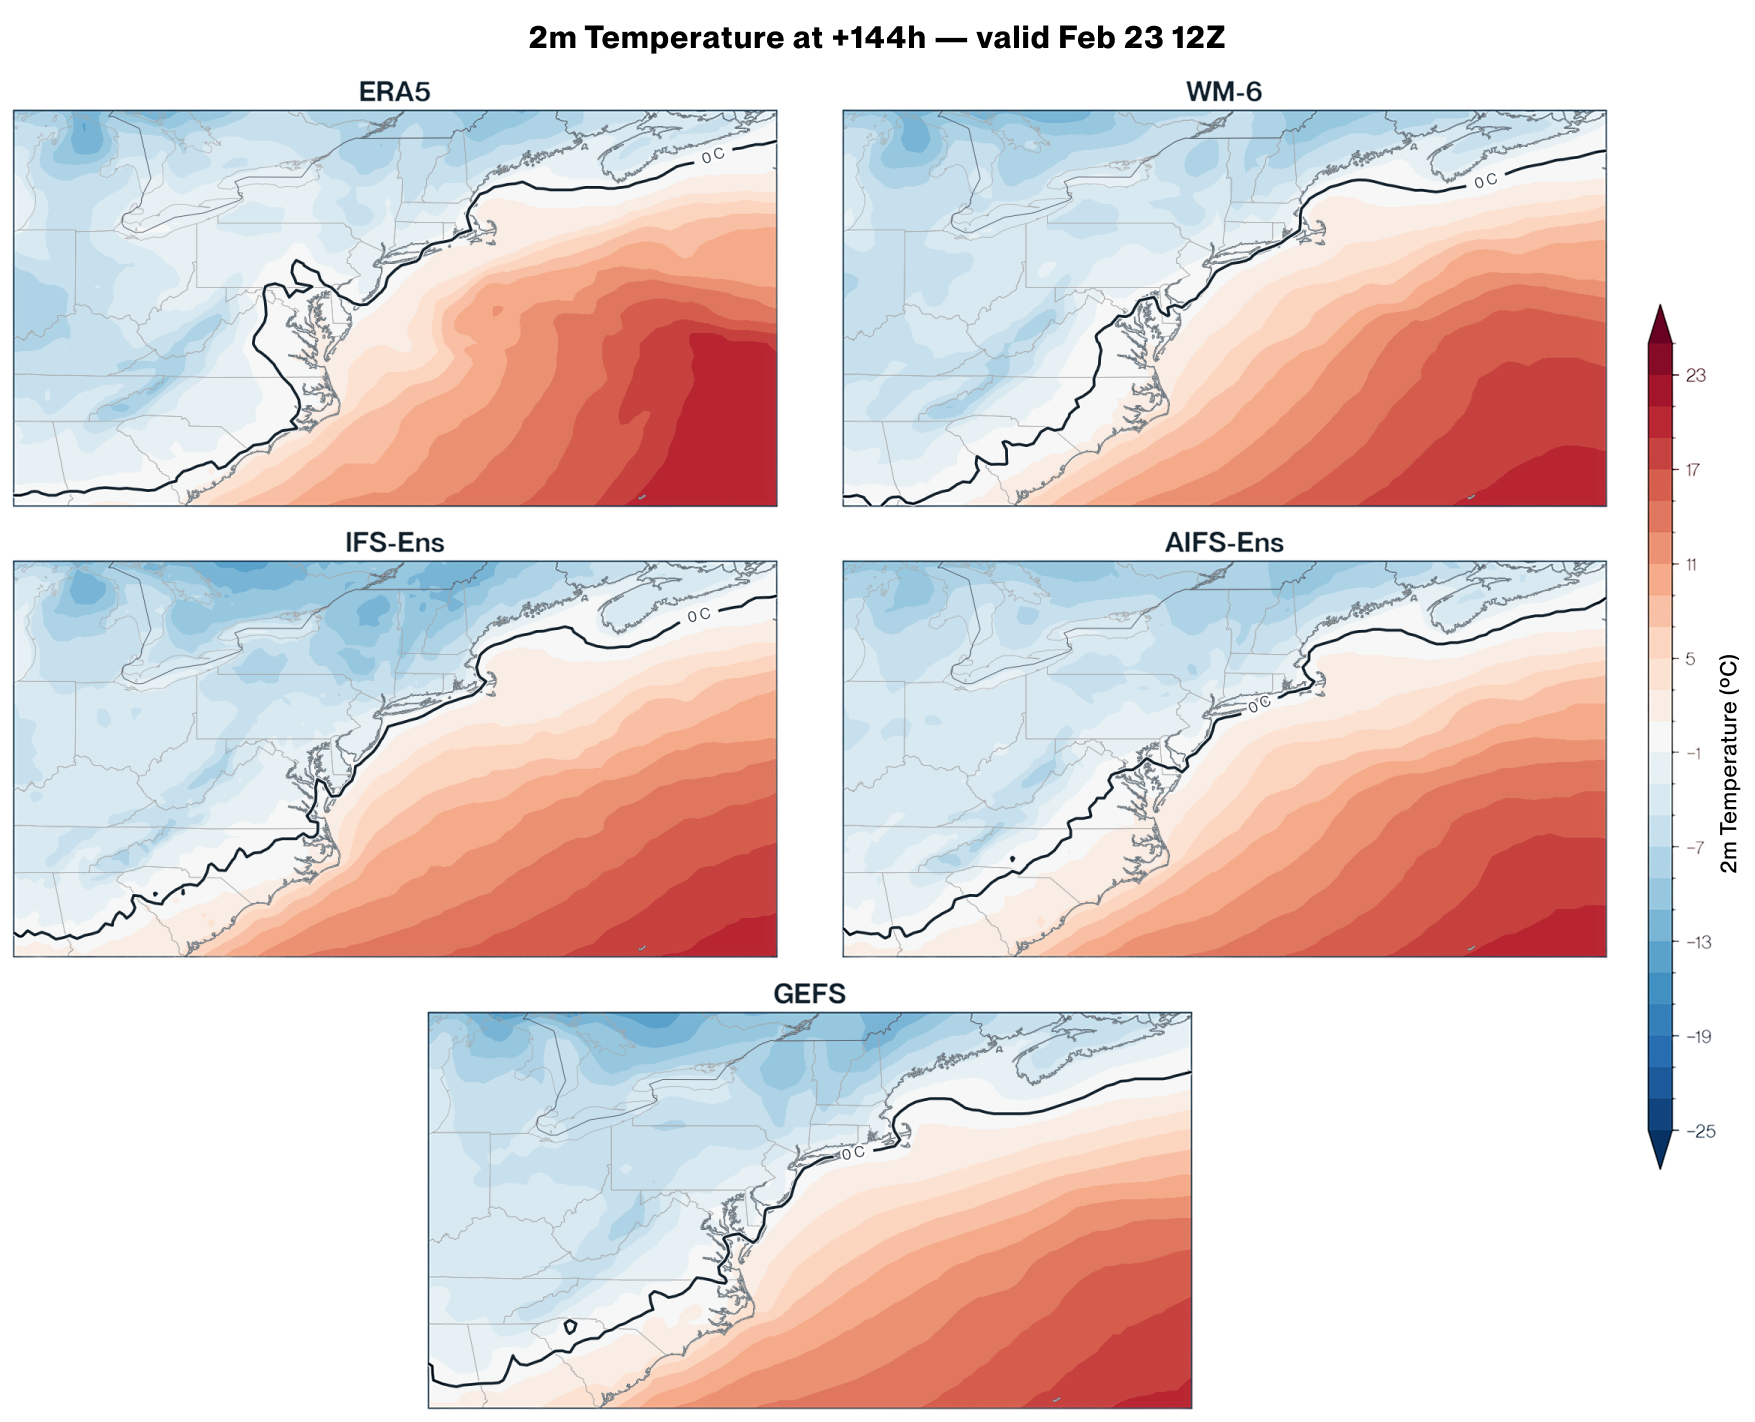
For the cities along the I-95 corridor, this storm came down to a single degree. A surface temperature just below freezing means heavy snow; just above, it falls as rain. Washington and Baltimore sat right on that line.
Most models came down firmly on the cold side, showing a confident, big-snow outcome for the Mid-Atlantic. WeatherMesh saw it differently. It picked up a push of warmer air moving north along the Chesapeake Bay, a signal the other models smoothed away. It did not promise rain, but run after run it flagged the same risk: heavy snow here was not a certainty, and could just as easily fall as rain.
That risk was real. Across all six runs, WeatherMesh kept Washington within a degree of freezing, between roughly -0.5 and +1°C. It never locked in the confident cold the other models showed. Washington verified at +0.5°C, squarely in the marginal range WeatherMesh had pointed to for six straight days.
Paired with WeatherMesh's precipitation forecast, the picture was clear well ahead of the storm: big snow in Washington and Baltimore was not the sure thing other models implied, while snow in New York City was. Six days out, a forecaster could already tell those two stories apart.
After the Storm
On February 23, the storm peaked just south of New England, right where WeatherMesh had placed it six days earlier.
WeatherMesh saw the extreme event first, and continued sharpening it by the hour. This storm's forecasted accuracy is not an anomaly: we have seen the same pattern across other retrospectives we have run on WeatherMesh-6. When there is enough confidence, the model commits to a big event early and refines it as the data arrives, which is exactly what you want from a forecast at medium to long range. Results like these motivates our team to keep advancing the architecture, expanding the input set, and growing the global balloon network that feeds WeatherMesh underneath it all.
To see how WeatherMesh would have called a specific event in your own portfolio, get in touch with our team.


